Decide what better is meant to mean
A comparison becomes difficult when its central word remains undefined. Better might mean more successful in a particular competition phase, faster scoring in a specified role or a stronger record across a shared set of opportunities. Those are different questions. Before collecting numbers, write the question in a sentence that another reader could challenge. A defined comparison gives the evidence a job instead of allowing the evidence to choose whichever argument looks most impressive.
This is a current cricket reading note, not a forecast or a report about the teams named in its historical address. All numerical examples are invented. The Sportshjørnet reading desk introduces the wider method: identify the task, check the observation and keep the conclusion within its evidence. Here we use that method to compare two fictional records without turning a convenient statistic into a complete sporting verdict.
Draw the sample boundary first
Choose the period or set of matches before looking for the most favourable outcome. A shared competition phase is one possible boundary. A defined role in a specified format is another. Whatever you choose, explain why it answers the question. If each team receives a different window simply because one window improves its numbers, the comparison is being shaped by the conclusion rather than the other way around.
Record exclusions too. An abandoned match, an unavailable record or a change in format may require a decision about inclusion. The important thing is not to hide that decision. Another reader should be able to reproduce the boundary and understand why an item lies outside it. A transparent imperfect sample is more useful than an apparently complete sample whose construction cannot be inspected.
Use a fictional result table
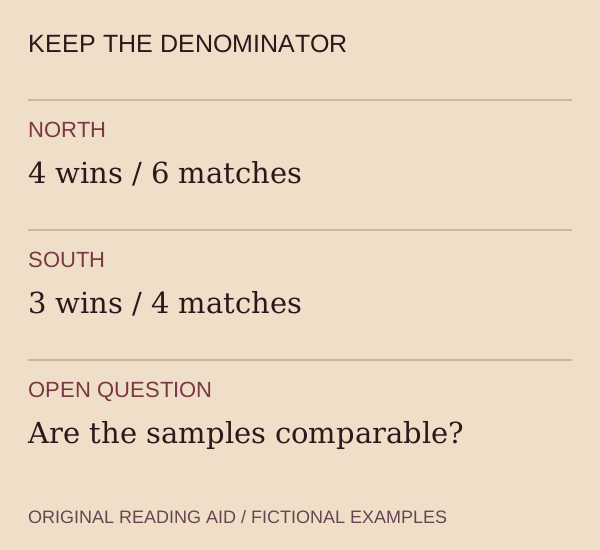
Imagine two invented teams, North and South, in a deliberately simplified exercise. North has four wins from six completed matches; South has three wins from four. As fractions, those records are four sixths and three quarters. The second fraction is larger, but that arithmetic alone does not establish that South is the stronger team. Opponents, conditions, format and the reason for choosing those matches remain unspecified.
The accompanying diagram shows the counts as counts, with their denominators visible. It is not a probability model and does not assign a chance to a future result. This distinction matters because a percentage often looks more authoritative than the small record beneath it. Converting three wins from four matches into a percentage does not create additional observations. The sample remains four completed matches, whatever typographic emphasis the percentage receives.
A fair paragraph would say that South has the higher win fraction in this invented selection of completed matches, then state the missing context. A less careful paragraph would turn the same fraction into a prediction or a universal ranking. The arithmetic would be identical in both paragraphs; the difference lies in the claim attached to it. Good statistical reading is therefore partly a discipline of language.
Keep the units compatible
When moving from results to player or team rates, inspect the denominator. Runs per over, runs per ball and runs per dismissal answer different questions. They cannot be swapped simply because each produces a compact number. A comparison should name the measure and show enough of the inputs for a reader to reconstruct it. If you cannot explain what the denominator represents, the calculation is not ready to support an argument.
Over notation deserves particular care. In a six-ball-over setting, 7.2 overs represents 44 valid balls, not seven point two decimal overs. Any rate calculation using that passage must respect the notation. A tiny error in the input can survive inside a neatly rounded final answer. The safeguard is simple: convert to a consistent unit first, perform the calculation second, then label the result in the unit you intend to discuss.
Distinguish record from explanation
A result table tells you what happened within its scope. It does not, on its own, establish why. A team may have won a particular match for several interacting reasons, and a short public record may not let the reader separate them. Avoid attaching a single causal story to every result merely because the story is memorable. An explanation requires evidence relevant to the proposed cause, not just an outcome that fits it.
For example, a reader might propose that one role made a decisive contribution. The next step is to inspect that role in the relevant passages, not repeat the final score with greater confidence. The selection framework offers a way to organise those task-based questions. It does not promise access to private tactical reasoning, and neither does this comparison exercise.
Check the quality of the record
Two sources may cover the same sporting period with different levels of detail. One may provide a complete scorecard while another supplies only a summary. Treat that imbalance as a limitation rather than filling the missing fields with assumptions. A blank observation is not a zero. If the data needed for a proposed rate are absent, choose a smaller claim or state that the comparison cannot yet be made reliably.
Timing also matters. A provisional total and a corrected final record should not be used as if they were equivalent versions. Keep the source and update information with the inputs. If a correction changes a denominator or a result classification, revisit the comparison instead of updating a single cell and leaving the conclusion untouched. A reproducible argument includes the version of the record on which it depends.
Ask what could change your mind
A useful comparison states at least one way it could be weakened. Would a shared window produce a different picture? Would separating formats remove the apparent advantage? Would more comparable opportunities matter? These are not tricks for dismissing an inconvenient record. They are checks against a conclusion that has become immune to evidence. A sporting opinion can be strongly held while still identifying the observations that would require it to be revised.
There is no universal sample size that makes every cricket claim safe. The amount and relevance of evidence depend on the question, the variability of the observations and the size of the claim. This article deliberately avoids offering a magic threshold. It is more useful to explain what your actual sample contains and why its limits matter than to hide behind a round number with no connection to the comparison.
Write the conclusion at the right scale
Try a final structure with four parts: question, boundary, observation and limit. Name the comparison, explain the sample, give the result and identify what the result does not settle. That structure can fit in a short paragraph. It makes disagreement productive because another reader can locate the step they want to challenge instead of arguing against an unexplained headline.
The ICC format overview is a primary introductory reference when identifying the international format in scope. Cricketin's English explainers are a sponsored partner reading link for further terminology. Neither source supplies the invented North and South figures. Those figures are original teaching material, used to show why a correct fraction and a justified sporting conclusion are related questions rather than the same thing.
A useful result can remain inconclusive
Sometimes the exercise ends without a ranking. That can be the correct outcome when the available records answer different questions. Keep the observations that are defensible and leave the larger question open. You have still learned how the samples differ, which inputs are missing and what further evidence would be relevant. An unresolved comparison is more informative than a confident verdict built by quietly changing the question halfway through the calculation.